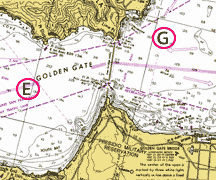
A new reference station, "Golden Gate Bridge", indicated by the "G" in the red circle at 37 deg 49.75 min N, 122 deg 27.73 min W is about 0.9 miles East of the North end of the bridge. This new station is now the reference for the central region in the bay while the outside station remains the reference for locations on the coast outside the Golden Gate.
Currents can be very dependent on location, sometimes even changing direction over a short distance (see Vortex). However, we can ask three specific questions about the currents at these two locations:
1. How different are the currents at the stations?
2. Are the differences of a magnitude or type that would preclude G just being a subordinate of E (and thus other stations inside the bay being subordinates of E)?
3. Will the use of G as a reference station (instead of E) improve current predictions for subordinate stations in the bay?

Predictions at a subordinate station are derived from the predictions at a reference station using six parameters: a flood and ebb velocity multiplier; a time difference for flood, slack before ebb, ebb, and slack before flood. These six parameters are constant the year around, and thus there is no daily tabulation.
The table on the left gives the year 2001 maximum, average, and minimum peak currents, in knots, at the two stations for the year 2001. The statistics for flood currents are similar, but ebb currents seem to range from 1.5 to 3 times stronger at the Entrance than inside. Thus, the ebb velocities do not seem to be related by a constant ratio. However, this table tells us nothing about comparable pairs of similar velocities at each station. The ratio of ebb velocities at the two stations is plotted in the graph below, where it is seen that there is a great deal of variability.
| SF Entrance | GG Bridge | |
| flood max | 4.7 | 4.5 |
| ........ avg | 3.0 | 2.8 |
| ........ min | 1.1 | 1.2 |
| ebb max | -6.0 | -3.8 |
| ........avg | -3.4 | -1.8 |
| .......min | -1.2 | -0.4 |

The graph on the left shows the ratio of ebb velocities at the GG station to those at the Entrance station (vertical axis) plotted against the velocity at the Entrance (horizontal axis).
The ratio is clearly not constant at medium to low ebb velocities. Thus, it would be impossible to give good predictions for the GG station only knowing the velocity at the Entrance.
Averaged over the year, the phases of the currents (flood, slack, ebb...) occur 29 minutes earlier at the Golden Gate (inside) station compared to the Entrance (outside) station *.
However, the time differences are clearly not constant: the ebb flow can start 108 minutes earlier or 68 minutes later at the GG station compared to the Entrance station.
Thus, we can assume that the use of the Outside station as a reference for inside subordinate stations gave erroneous predictions, and expect that the use of the Inside GG Gate station as a reference will give better predictions for nearby subordinate stations.
| max | avg | min | |
| flood | 46 | 27 | 7 |
| slack before ebb | 56 | 25 | -19 |
| ebb | 108 | 21 | -68 |
| slack before flood | 114 | 43 | -1 |