Zebrafish [Danio rerio]
Zebrafish [ZF] have become very popular in the last few decades as a model organism in the study of vertebrates. But what is a model organism?
Scientific research is mostly a group or community effort. Scientists publish papers read by their community, go to meetings and exchange information and materials in many ways. Of course there is competition, but cooperation usually dominates in the long term.
Biologists have a special problem. There are an almost uncountable number of species, each with their separate anatomies and life patterns, so that if every lab studied a different species it would be difficult for one group to gain much from the work of others. However, if several labs study the same species they can complement each other and create a much more detailed understanding. It almost doesn’t matter which organism is chosen, it may be just convenience.
How popular are zebrafish for research?
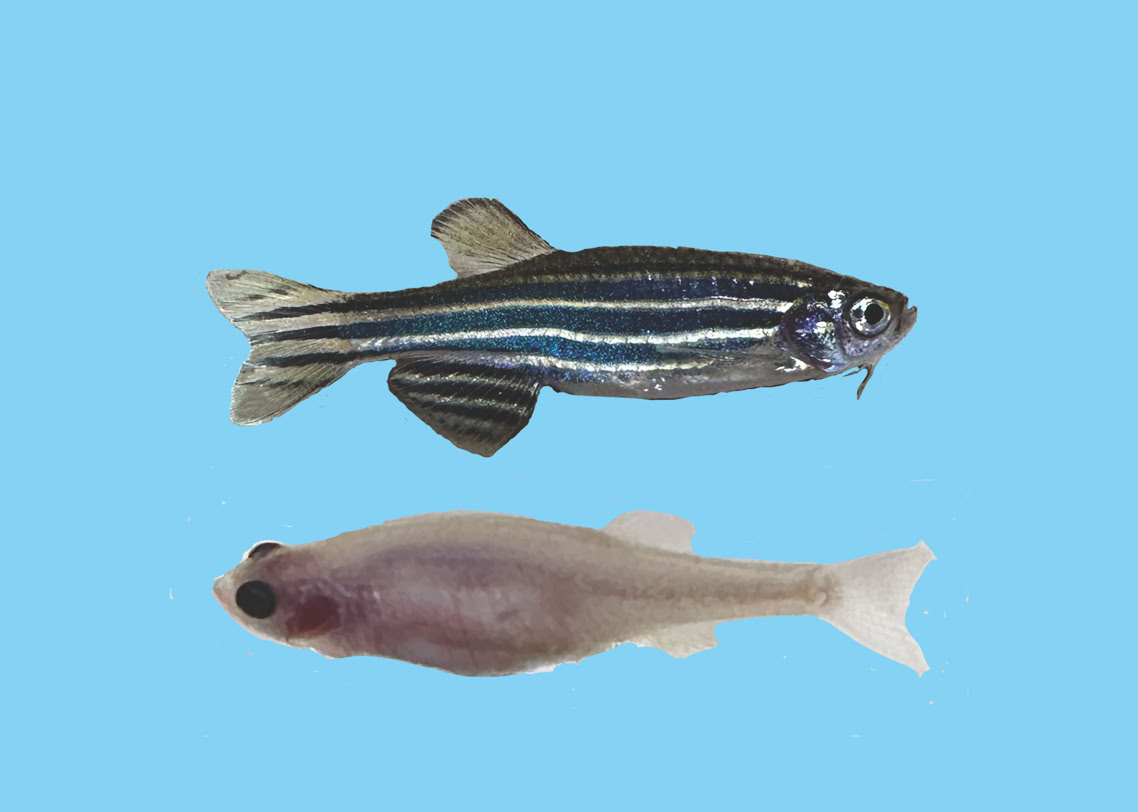
The top fish is the one found in the wild. It is about 3 cm (1.3 inch) long. It commonly lives in fresh water streams in South Eastern Asia, and thrives at temperatures in the 25-28 C range.
The bottom fish is a mutant with two pigment producing genes inactivated. It is named Casper after the cartoon ghost. This mutant is the one I use since it is almost transparent allowing the internal organs and blood flow to be clearly seen.
By 2025 over 9,000 researchers in 1,551 labs throughout 31 countries study zebrafish [Wikipedia]. Scientific study of zebrafish was initiated in the late 1960’s by George Streisinger at the University of Oregon at Eugene. Eugene is the location of one of the repositories of zebrafish genetic variants, and has more than 40,000 listed in its data base. Scientists all over the world obtain variants from them.
Genetic variants are powerful tools
Genetic variants are organisms that have altered genes, DNA. The alteration can be simple, as the change or deletion of a few nucleotides that renders the final gene product, a protein, inactive. The Casper strain of zebrafish is an example, two pigment genes have been altered so no functional pigments are produced. This fish is translucent. But this is the age of genetic engineering, so the alteration can be far more sophisticated, like insertion of a gene fragment into the fish from another organism or a fragment synthesized chemically. Such variants enable the field of optogenetics [Wikipedia], in which, for example, the activity of neurons can both be triggered and observed by light. Thus, instead using the challenging process of inserting a thin electrode into a single nerve cell to measure or induce an electrical signal you just observe under a microscope flashes of light from all the neurons in the brain simultaneously .
Now you can see why genetic variants are such important tools, they are a revolutionary technique. However, these variants can take a great deal of time and effort to create and characterize. If you have one model organism that thousands of people are working with and generating and sharing genetic variants, you have a powerful machine, the zebrafish community.
Recording the heartbeat
It’s possible to record the heartbeat of a zebrafish from a video made from a consumer level camera attached to a microscope. The image on the right is a ZF in a petri dish of water containing a anesthetic. The ZF is on its side, inverted and the two chambers of the heart are just right and slightly above the center of the frame. The atrium is the slightly darker lower spot and the ventricle is the slightly larger and less dense area above and to the right. The heartbeat can be followed by converting the video to a sequence of frames, here 30 frames per second, and converting them from color to gray scale.
These conversations, and the many more operations required for analysis, require a great deal of computer code. I am using the Mathematica application which contains many hundreds of routines to manipulate images and data.

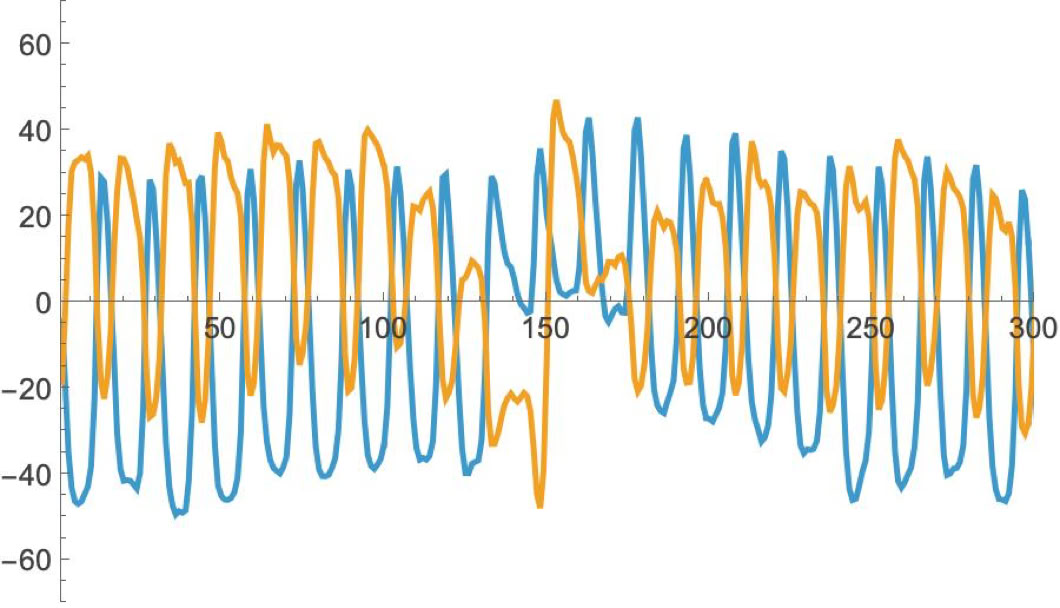
You see on the right that the two chambers fill and empty exactly 180 degrees out of phase. Thus, measuring the total grey level in both regions would give a much lower signal and give a misleading model of the heart beat.
Arrhythmias

I do not follow movement of the edge of the heart chambers, but rather changes in total intensity in two fixed regions. The regions are determined by examination of the difference between frames two frames apart, e.g. f1 - f3. Only the regions enclosing the heart chambers change, the rest of the image is constant.
The image on the left is a difference frame from the above video. The black smudge is the atrium and the white smudge is the ventricle.
Below is a plot of the total intensities in both regions over 60 frames, or 2 seconds. There are about 4 cycles in the plot, thus the heart rate is 2 beats per sec.
Blue = atrium, Yellow = ventricle
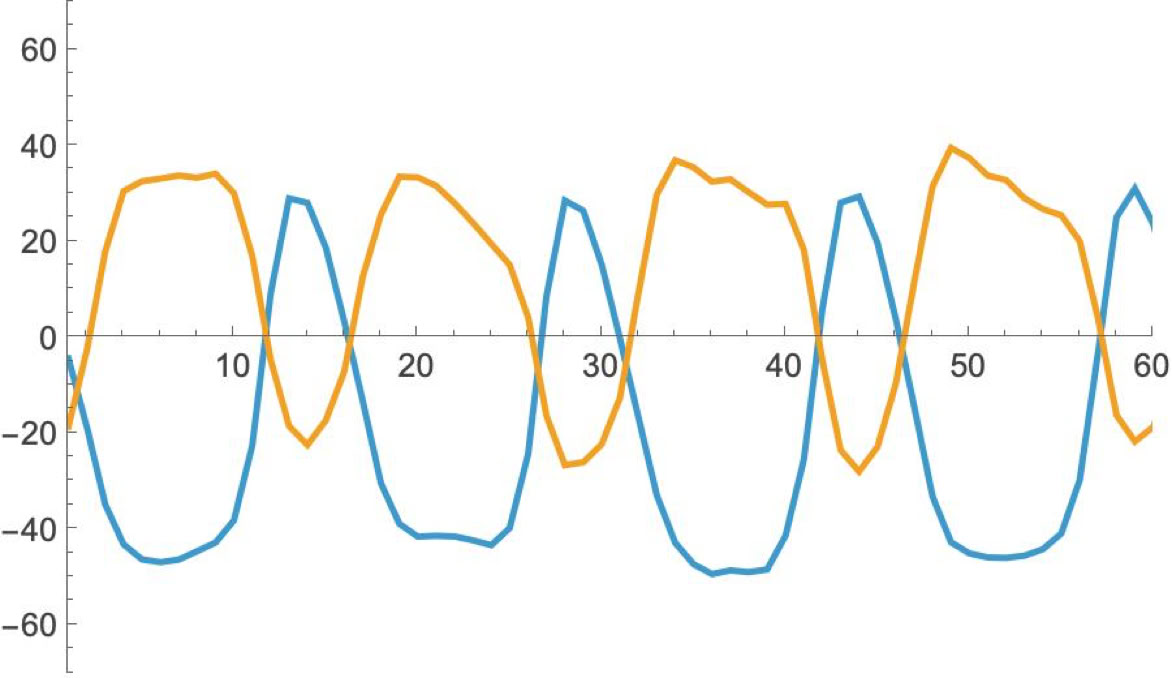
A heart beat over 300 frames, or 10 seconds, is plotted on the left . This fish is at an elevated temperature, causing the heart to occasionally fibrillate, thus interrupting the normal rhythm. This is a very important class of heart failures. I hope to learn more about the details of this behavior in future experiments.